Sunday
May272012

Understanding Social Media "Insanity"

"Insanity is relative. It depends on who has who locked in what cage." ~ Ray Bradbury

Well the Facebook IPO has been completed, and the first crazy thing we might consider is the diversity of opinions on the success or failure of the IPO. Put me in the "success" camp -- the objective of an IPO is to raise money in exchange for a share of the company. Offering shares at $38 was a great deal for Facebook, and if the market now values those shares at 16% less, that only reinforces the notion that Facebook got an impressive price for its shares.

The valuation of Facebook is a second insanity that we might consider. Most analysts have focused on the monetization of pageviews, noting (for example) that Google generates a lot more revenue per pageview, and that this speaks of strong monetization upside potential for Facebook. This may be so, but we should also consider that Facebook is a media channel, and that there are a booming number of media channels competing for eyeballs and online time.

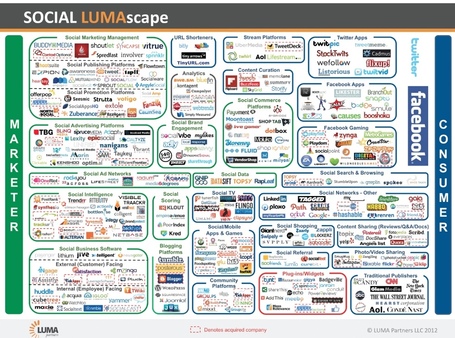
Business Insider started all this with their article: This INSANE Graphic Shows How Ludicrously Complicated Social Media Marketing Is Now. That graphic, as well as the more florid one here: The Conversation Prism show hundreds of competitors for a slice of the social pie.

So many companies, so little time. Why do they bother? Why would another company ply the Social space? Sure, Google and Facebook might buy a bunch of them, but why should Google and Facebook do that? To clear up this seeming insanity, let's take a look at how eyeballs and share might work in a social media space. To sort things out we'll apply a technique called Markov Analysis to the Social Media space.

Markov analysis is an evaluation approach that uses the current movement of a variable to predict the future movement of that variable. Here we'll look at the "Url Shortener" subset of the Social space, but the same approach can be used independent of the number of companies under review. We've played with URL shortener's before, describing them here: Spreadsheets for the New Millennium and implementing one here: MiniURLs for the Masses, but this time we're going to look at three of the leading URL shortener offerings: bit.ly, tinyarrows and tinyurl.com.

To get started with our analysis we need to look at the current share for our providers and to get a sense of where customers come from for each of our providers, Bit.ly, TinyArrows and TinyURL. A hypothetical model of that information is presented in what is called a Transition Table, as shown below:

Here's how to read a Transition Table:

  1. Start with initial customer counts and market share
  2. For each provider and each competitor, note the gains and losses for the time period in question
  3. A single "play" of the Transition Table takes us from May market share to June market share

Microsoft Excel is not a bad place to start for share analyses, but for our calculations (and for a greater number of providers, certainly) we'll want a more powerful tool with Matrix math and/or linear algebra functionality, like NumPy (for Python), or linalg (for Fortran through Ruby). For the purposes of this review, I'll use Mathematica to show the essential matrix calculations that can show us evolving Markov analysis for estimating market share.

In this analysis we'll use a first-order Markov process, and assume that the customer purchase decision for each month depends only on the choices available for that month. Studies have shown that first order Markov processes can be successful at predicting web behavior, particularly if the transition matrix is stable.

We can load our transition matrix into Mathematica, where the Mathematica transition matrix vectors are generated by calculating losses to competitors: Bit.ly (for example), kept 920 customers in May, but lost 23 to TinyArrows and 57 to TinyURL, yielding their vector of {.920, .023, .057 }.

The result is shown below:

The key to Markov analysis is the ability to determine or estimate the number of customers gained-from and lost-to competitors. Web analytics can often provide an estimate for such customer migrations, as can the results of a "competitive upgrade" marketing program.

Markov analysis for a single month can show meaningful transitions, but a more useful analysis can be had when

  1. The transition matrix is assumed to be stable, and
  2. The model is used to determine equilibrium market shares

Such an analysis is shown below:

As we might guess from the initial transition table, this is a very favorable market for Bit.ly, based in the hypothetical numbers presented here. Bit.ly started with an even share of the market, but will evolve to nearly double the market share of its competitors with the transition table shown here. If there are second-order effects (such as Bit.ly being seen as a "leader" in potential customers' eyes) then the share gain my be even larger than that shown here.

But that's not the only fascinating thing about Markov analysis here. It's not where you start the game, but how well you play it. If we keep the transition matrix constant (i.e. how the game is played), then even if we drop Bit.ly and Tinyarrows to 1% market share and play the game to equilibrium, we still end up with the same basic equilibrium that we'd achieved from even shares! The effect of playing this game to equilibrium is shown below:

So perhaps this is the "Ah HA!" of the crowded social media space, and the reason that small companies keep entering the space to try to carve their niche in it. The model here might suggest the following:

  1. In a world of compute clouds, the barriers-to-entry for social media startups is low
  2. The social media space is new enough that many firms with "one-stripe zebra" distinctive competencies might still carve out and defend niches successfully -- they play well
  3. Publicly traded firms (like Facebook and Google) are compelled to increase market share and earnings and have powerful incentives to change the nature of competition -- to "shake up" the transition matrix from time to time
  4. Nothing shakes up a transition matrix like the acquisition of a competitor
  5. Technology tends to produce natural monopolies, but only if a leader can acquire enough share that higher-order monopolistic effects take over

So -- when all is said and done, it really is in the interest of lots of niche firms to try to carve out a defensible space, and it is in Facebook's and Google's interest to acquire the pieces that let the "natural monopolies" play out.

So -- Social Media "Insanity?" -- "Crazy like a fox" is more like it.

Sunday
Feb052012

Consumerizing Big Data

Perfection is achieved, not when there is nothing more to add, but when there is nothing left to take away.
~ Antoine de Saint Exupéry

These are great days for Big Data -- Oracle's now in the game with an appliance and a new database, Microsoft has all kinds of new initiatives post-Dryad, and Amazon is going big data and Enterprise with DynamoDB.

Where are we going with this? The new initiatives may validate the space but they belie the notion that "more is better." More is better, but only until the field gets swept by less. 37Signals suggests that you Underdo your competition, and the late Steve Jobs raised simplicity to a high art. I suggest that Big Data will reach gestalt when we agree, not on more, but on less.

To appreciate the power of less, lets go back to one of my favorite Big Data solutions -- the one based on the terrific Phil Whelan article: Map Reduce with Ruby Using Hadoop. We got a nice solution working last year, and I posted about it then. In that posting, I noted that Cloudera scripts make Hadoop accessible for the masses, but was that all there is to it?

As with late-night-TV, I have to offer: "But Wait! There's More..." Indeed there is, and better yet there's Less. To show where we're headed let's take another look at that Hadoop solution.

The Hadoop app we wrote last year was based on an earlier version of Cloudera's Hadoop release -- CDH version 0.1.0+23. That version was a lot of Cloudera ago, so we'll explore Hadoop with the latest version, CDH version 3 Update 3. CDH3 U3 integrates Hadoop 0.20.2 with a lot of goodies that we'll see later, including

  • Mahout 0.5+9.3 -- we'll see this later as part of our Recommendation Engine
  • Hive-0.7.1+42.36 and Pig 0.8.1+28.26 for programming
  • Whirr 0.5.0+4.8 -- we'll use here for cloud integration, and
  • Zookeeper 3.3.4+19 -- to coordinate the processes we spawn

Download and installation are much as we performed last year, and we'll start with a similar word-count application that we ran last year. But first -- let's define our data input sources and output directory, and kick off our Hadoop run:

Now we've got input $IN and output $OUT sources set, and after a bunch of output to STDOUT we pull things together with:

...and we can go to $OUT to see the results:

So fine so far -- we've got the same 13 aardvarks and aardwolves we had last year, from the same Macintosh dictionary file we looked at last year. One dictionary is nice, but by setting the input and output directories as we have we can run Hadoop on much more than just one file. Since we routinely run on Ubuntu Linux, let's take its dictionary file was well and add it to the mix. Here I've got a copy of the Ubuntu dictionary, entitled "unix_words." Let's copy it on in, and have another run.

First we'll add in unix_words and kick off the Hadoop run:

It runs much as before, and here are our results:

Bingo! Our varks and wolves are now supplanted by "a'" at the top of our list, but there are 21 of them now. We could add more data, hundreds more or thousands more input files and it's a one-line command to perform the analysis. But that's not all we can do. As we did last year, we have simple map and reduce files -- let's try adjusting the map file to sort by the first THREE letters this time.

It's a simple 2-line change to make our map function grab 3-letter combinations. Here's our new map.rb function.

We can save it, and as we've defined a run_hadoop function and set $IN and $OUT, we can trigger our ./run_hadoop and see the new results.

Simple start -- we'll clear out our previous $OUT results, and with the new map.rb file we'll kick off another Hadoop run. Here we made a simple change (2 letters to 3) but there's no reason we couldn't get more creative with our simple map and reduce functions. Let's see what we get:

So there we are. Our analysis is not exactly Turing-award rich, but we've got a couple of things here that might really change the game for Big Data analysis. Specifically, we've got

  • A standard input target directory (could be "file system," but this is a start)
  • A standard output target
  • A flexible, readable map function
  • Standard location and processing for output

We have the core components of a big data application emerging. Rather than "one-offing" Big Data analysis, we can standardize the basic approach by

  • Enriching the mappers and reducers
  • Expanding our input processing, and
  • Feed our outputs to visualization tools like Jaspersoft or Tableau

If we put the platform on a standard (HBase) data store and tie in search engine and matrix processing we start to approach the long-sought spreadsheet for the new millennium. We're still just getting started, but the future is this way...

Sunday
Jan152012

You Only Live Twice (Basho and Riak)

You only live twice...
When you are born, and
When you look death in the face
Ian Fleming ~ "You Only Live Twice"

It's not about the bike. It's a metaphor for life...
Lance Armstrong ~ "It's Not About the Bike"

Today was a big day for me. Way back on June 6, 2008 I was in a terrible car-bike accident. It was so bad that the first word that got sent to a traffic copter overhead was that I'd been killed. I hadn't, but it was a couple of months of hospitalization and six months of hard rehab before I was back to anything like my life before the accident again. I got great support from my family and with great care and therapy I even got back on the bike again.

January 1, 2009 was my first post-accident bike ride - 1.4 miles around Clement Park lake here in Littleton, Colorado. As little as that was, I kept at it and today, 3 years later, I completed my 10,000th mile since the accident. It's true that you "only live twice," and the greatest gift in life is to come back from that edge.

The quotation above is a haiku coined by James Bond in the book "You Only Live Twice," which Bond himself declares "...after Basho..." -- referring to Matsuo Basho, the great Japanese poet (1644-1694). Basho was the master of the haiku, and a nice sampling of his work can be found here: A Selection of Matsuo Basho's Haiku.

Basho may be revered as a poet-laureate of Japan (something like Robert Frost is considered here) but it's a shame that there's so little awareness of his work. Our world is full of fine, obscure art, and the joy of an internet-enabled world is that it's not so hard to find it anymore.

Basho's name (if not his verse) lives on in the NoSQL datastore company Basho, and through their key-value store database Riak. I spent the weekend getting Riak rolling in the cloud -- it's not hard to set up, and it's scalable, flexible and fast as a key-value store. Here's a quick peek at how I got there:

Riak was designed for robustness, speed and scalability, and to get started with Riak you'll need to install the programming language Erlang first. Riak was built with Erlang, and Erlang is a terrific jackrabbit of a language that even on its own is absolutely worth a look. I was running 10.04 LTS (Lucid Lynx) on AWS, and in that world the Erlang install only took 4 steps:

curl -O http://erlang.org/download/otp_src_R14B03.tar.gz
tar zxvf otp_src_R14B03.tar.gz
cd otp_src_R14B03
./configure && make && sudo make install

The latest Erlang (R15B) doesn't work yet with the latest (1.02) Riak, so you'll want to make sure you're linking compatible pairs of Erlang and Riak. Once that's complete, it's also a simple set of steps to install Riak:

curl -O http://downloads.basho.com/riak/riak-1.0.2/riak-1.0.2.tar.gz
tar zxvf riak-1.0.2.tar.gz
cd riak-1.0.2
make rel

With Erland and Riak installed we're ready to get rolling. Inasmuch as I see "Big Data" as an emerging data structure and both NoSQL and Hadoop as tools forming the operating system around that data structure, I like (where I can) to stick to high-level languages and OBDM (object-big-data-mapping) tools for access to the structure. Fortunately, Sean Cribbs has just released Ripple, an Active Model-based document abstraction utility based on Active Record and MongoMapper. With Ripple added, we just need a bit of code (and a big assist to Justin Pease) to migrate our Redis-based URL shortener over to Riak. But first, let's get Riak working:

First we'll need a new Rails project to test Riak:

$rails new riaktest

Then we'll go into riaktest and add Ripple and curb to our Rails 3.x Gemfile, and do a bundle install:

gem 'ripple', :git => 'http://github.com/seancribbs/ripple.git'
gem 'curb'

Save the Gemfile, and then

$ bundle install

Next we'll add Ripple into or config/database.yml:

ripple:
  development:
    port: 8098
    host: localhost

Next we'll add a little Url class in app/models/url.rb:

require 'ripple'
class Url
  include Ripple::Document
  property :ukey, String, :presence => true
  property :url,    String
end

And finally we'll fire up Riak:

$ /var/www/apps/riak-1.0.2/rel/riak/bin/riak start

With our Development environment complete, we can now dive into Rails on the console and play with our Riak data store:

$ rails console@
Loading development environment (Rails 3.1.3)
ruby-1.9.2-p290 :001 > url = Url.new
 => <Url:[new] ukey=nil url=nil>
ruby-1.9.2-p290 :002 > url.ukey = "2432"
 => "2432" 
ruby-1.9.2-p290 :003 > url.url = "http://www.ibm.com"
 => "http://www.ibm.com" 
ruby-1.9.2-p290 :004 > url.valid?
 => true 
ruby-1.9.2-p290 :005 > url.save
 => true 
ruby-1.9.2-p290 :006 > exit

Great -- we've initialized our data store, and gone away (thus the "exit") above. Now we can come back and access our Riak store:

rails console
Loading development environment (Rails 3.1.3)
ruby-1.9.2-p290 :001 > newurl = Url.first
 => <Url:TdxQ3iFGEwkmfMrYQBmvwcZYoCM ukey="2432" url="http://www.ibm.com">
ruby-1.9.2-p290 :002 > exit

So we have Riak operational on the Amazon cloud, and it's a small matter of coding to move our Redis URL shortener over to a new back end. In my next posting I'll show how we can do that, and do a little Apache Benchmark testing to see how our little example applications benchmark out.

We'll end with a little inspiration from Lance Armstrong:

Wednesday
May252011

How do I get started? A General Solution to Discovery in Big Data

Source: http://www.flickr.com/photos/41829005@N02/6162370327/

I've used the "spreadsheet" as a metaphor for an epiphany -- in this case combining enabling technologies (cheap PC processing, high-resolution displays and cheap memory) to provide a new metaphor for problem solving. Spreadsheet visual programming is a perfect metaphor for financial analysis because the rows-and-columns of financial ledgers map crisply to rows and columns on a computer screen. The final essential piece of the "PC Data" revolution arrived when a macro language was built into Lotus 1-2-3 that hadn't been build into Visicalc. This single feature guaranteed the hegemony of 1-2-3 and spreadsheets, as the macro language made them capable of solving problems outside of the domains envisioned but the first spreadsheet's developers.

Before spreadsheets, if you had a problem you could either lay it out on paper, or have a programmer write a specific program to perform the analysis you wanted. "Exploration" and "Discovery" were limited to what you could describe to a developer to program. Life before spreadsheets was brutish and short…

Source: http://appraisalnewsonline.typepad.com/photos/uncategorized/2008/01/08/matrix_data.jpg

So here we are today, at the dawn of the Big Data era. The core toolset is emerging (MapReduce via the Hadoop family of products) and word is spreading that remarkable solutions might be found in data that we formerly thought of as "disposable." The old problem is back, though -- if you (as a manager or executive) want solutions, you better go find a programmer. There are steps being taken to bring us spreadsheets for big data -- Datameer particularly is bringing spreadsheets to Big Data. Or, more properly, bringing Big Data to spreadsheets. They may move Big Data forward, but there's an impedance mismatch here -- if Big Data naturally fit in the rows and columns of spreadsheets it would already have made the jump and be found there. If Big Data describes a world beyond rows and columns, then the spreadsheet metaphor will end up fitting Big Data like a bad suit. Sure, we'll have our familiar rows and columns, but like Mozart played on a kazoo something in the essential nature of the data will be lost.

The answer for Big Data is a spreadsheet conceptually, but with a richer representational metaphor than rows and columns. We want fundamental insights from big data, so our building blocks should match the topologies that we're studying. Here's a first take at what "rows and columns" for Big Data might look like:

  • Predictive Modeling -- stripped of scale, are there linear relationships in the data that offer explanatory or predictive value?
  • Clustering Partition -- is the data uniformly distributed or clustered, and what can we learn from the clusters?
  • N-Dimensional Visualization -- US Supreme Court Justice Potter Stewart once said that he couldn't define pornography, but "…He knew it when he saw it." Are there visual representations of Big Data that provide insight?
  • Outlier Analysis -- does the data follow a predictable distribution (normal, exponential, poisson, etc.) and if we can fit the data to control charts, and what is meant by outliers to those charts?
  • AB Analysis -- The data may be noisy, but can we use it to measure the performance of key variables against each other?
  • Markov Chains -- You know the score this far into the game, and your customers' web interactions foreshadow their interests going forward. Where are we heading, and when do we get there?

These are our rows and columns, and in my next post I'll describe the architecture I'm pursuing to explore them, an architecture built around:

  • HDFS for general data storage
  • HBase for data management
  • Hadoop for unstructured data analysis
  • Zookeeper for task management
  • SOLR for structured "free text" search
  • Thrift for access to external development languages and platforms
  • Massive_record to provide ORM-access to all that HBase data
  • JQuery for unobtrusive JavaScript and core visual presentation
  • SIMILE for advanced visual presentation
  • Tableau for advanced visual presentation
  • Node.js to serve up all that JavaScript

That's a lot to describe and it'll take some posting to do it, but the ultimate objective never changes -- to provide a sandbox that managers can play with and coax Big Data into giving up it's secrets.

Monday
May232011

Spreadsheets for the New Millennium -- Part 3

So here's what comes next:

When I write about "spreadsheets," I'm thinking about technology bringing a real innovation to market. Spreadsheets were a breakthrough in modern business because they took new technologies - low-cost PCs, high-resolution displays and comparatively large amounts of RAM - and combined them into a facile metaphor that fit a rich set of problems. Hadoop and MapReduce are terrific but they are elemental -- they provide a rich, parallel, functional-programming approach, but they remain basically metaphor-free. They are to Big Data what Quicksort is elementary computer science -- a nice step beyond Bubblesort, but in themselves just tools. The Killer App lies elsewhere.

For that reason I think Datameer and Factual are a step forward in the routinization of big data, but I don't think they've got it yet either. The metaphor is still wrong.

 Visicalc and Lotus 1-2-3 were a big step forward because they gave a hands-on way for non-IT people to grasp the rows-and-columns world of financial analysis. The impedance barrier went away because you could make financial models in a visual domain-specific language (DSL) that mirrored the world you were modeling.


The DSL has to match the world you're modeling, thus I expect that jamming big data into a spreadsheet today will be like jamming financial calculations into Wordstar would have been back then. It's a step forward (maybe a big one) but the gestalt will arrive elsewhere.

 When I wrote "big data needs a spreadsheet" in the past Spreadsheets for the New Millennium what I meant was that big data needs a metaphor and a DSL -- a way to put big data understanding into the hands of everyday users. Putting big data in a spreadsheet is a start, but these aren't rows-and-columns problem domains and stuffing them into rows and columns might provide some facility, but at a cost of richness and understanding.

 Big Data deserves its own metaphor and a DSL ... somebody's incubating it ... even as I type this ... now, where is it??? In my next post I'll lay out a few steps to the epiphany.

Page 1 ... 4 5 6 7 8 ... 11 Next 5 Entries »